The New vs. Returning report in Universal Analytics is an easy and simple way to see Sessions, Bounce Rate, Goal Completions, and more for new (first-time) website visitors compared to returning visitors.
At the time that this blog post is being written, the GA4 equivalent of the New vs. Returning report isn’t a 1-to-1 match. But we can get to the same data in GA4 in a few different ways, either:
Using the GA4 Retention Report to See New vs. Returning Users
If you’re simply looking to see how many new users and returning users you had in a certain time frame, head to the Retention report.
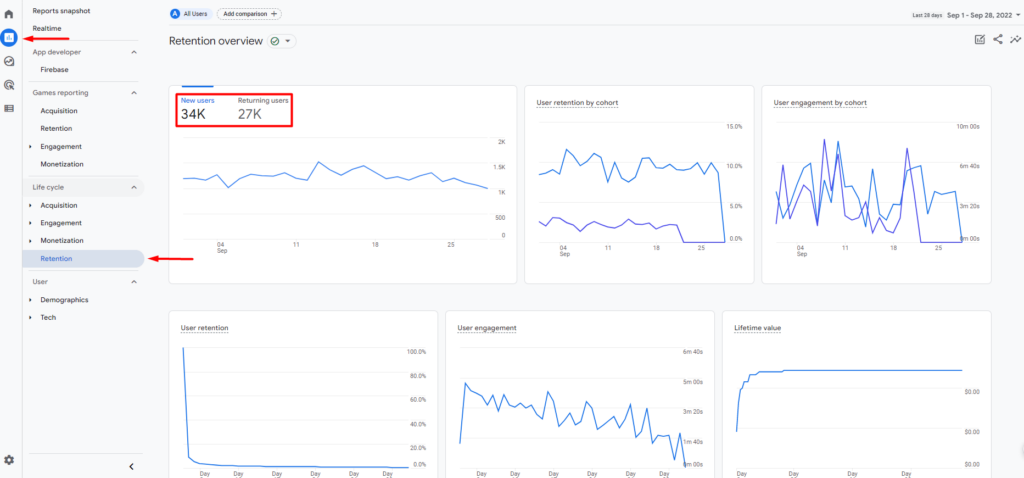
To find the Retention report, click Reports in the left-hand menu. Then under Life cycle, click Retention. Here, you can toggle between New users and Returning users.
If you want to see more in-depth data, click the pencil icon in the top right corner to add additional cards.
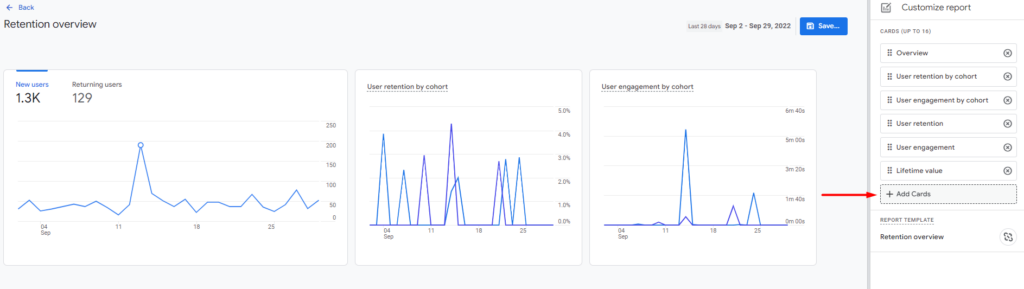
Then click +Add Cards.
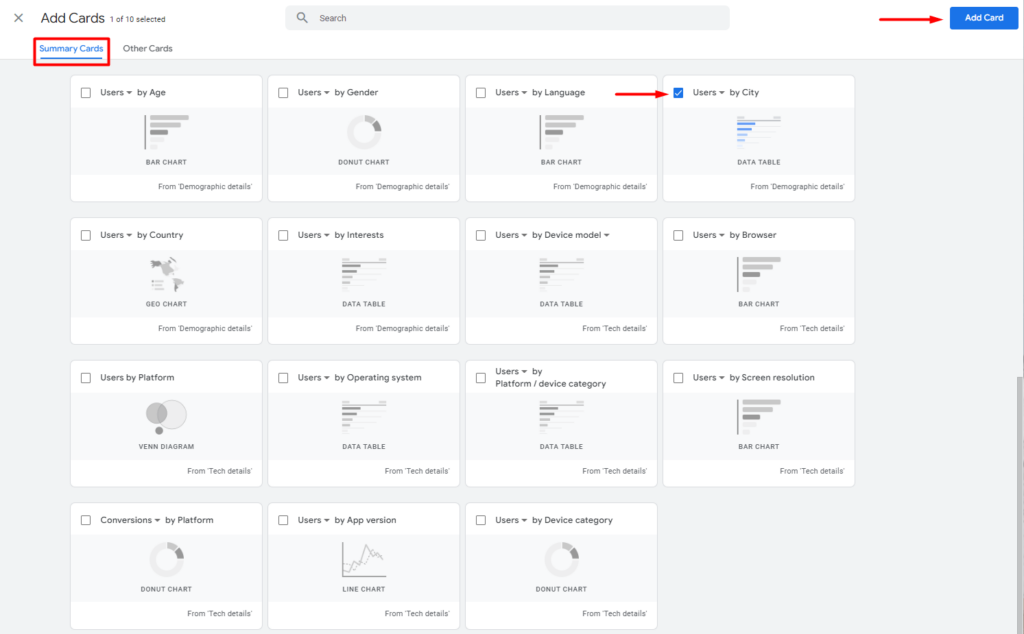
Scroll down to the User section in Summary Cards. You can choose from a variety of cards to add to your Retention report. For example, if you want to see what cities New Users vs. Returning Users are coming from, click the check box on the Users by City card and click Add Card in the top right corner.
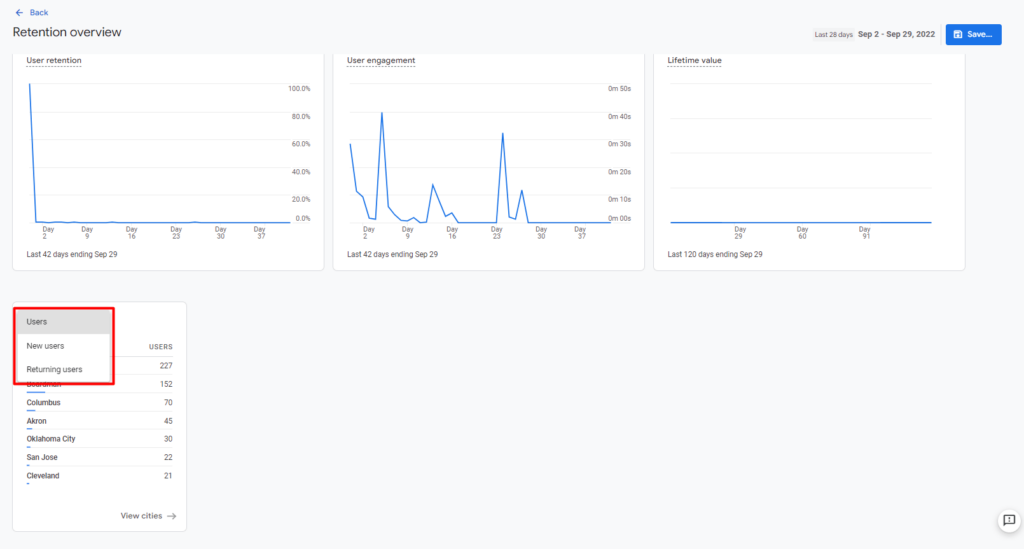
Once added to your report, you can toggle between New users and Returning users. You can use additional cards to further customize your report. Don’t forget to click Save and Save changes to current report if you want these cards to be in your Retention report for future use.
If you want to see conversions from new users vs. returning users, the easiest way is to customize your Conversions report, so let’s head there.
Customizing the Conversions Report to See New vs. Returning User Data
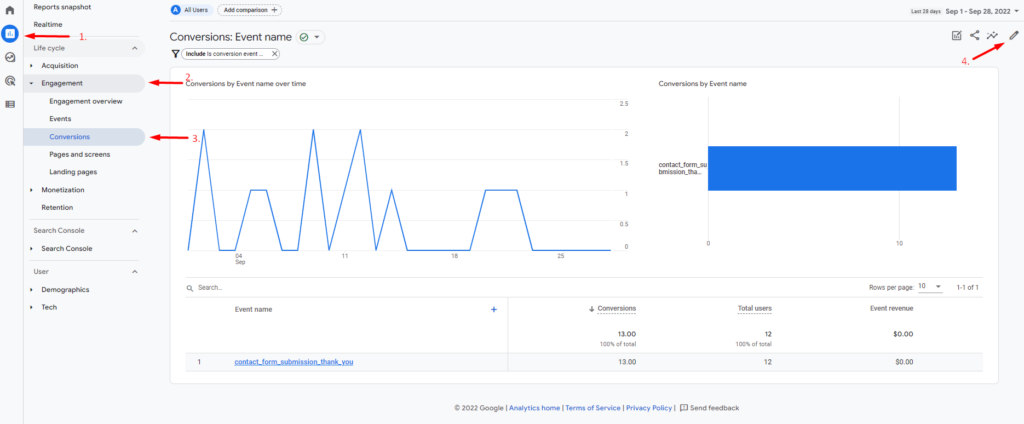
- Click Reports in the left-hand menu
- Click Engagement
- Under the Engagement drop-down, click Conversions
- Once you get to the Conversions report, click the pencil icon in the top right corner to customize the report
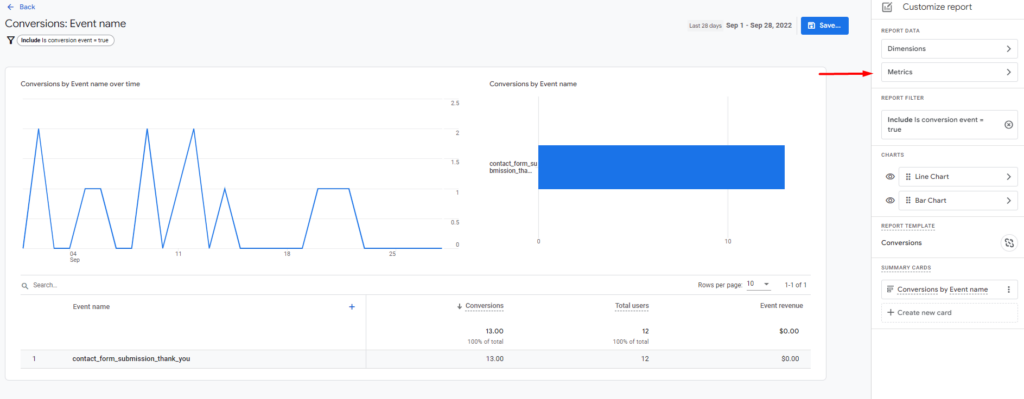
Click Metrics.
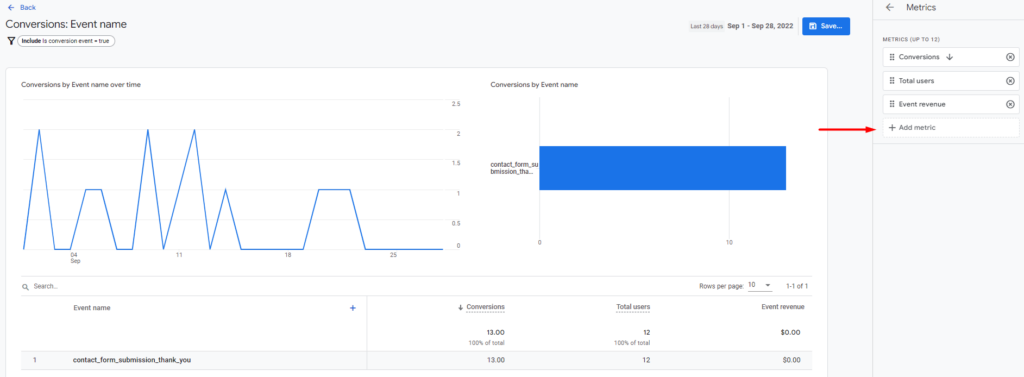
Then click +Add Metric and choose New users and Returning users from the list of options. Click the blue Apply button in the bottom right corner.
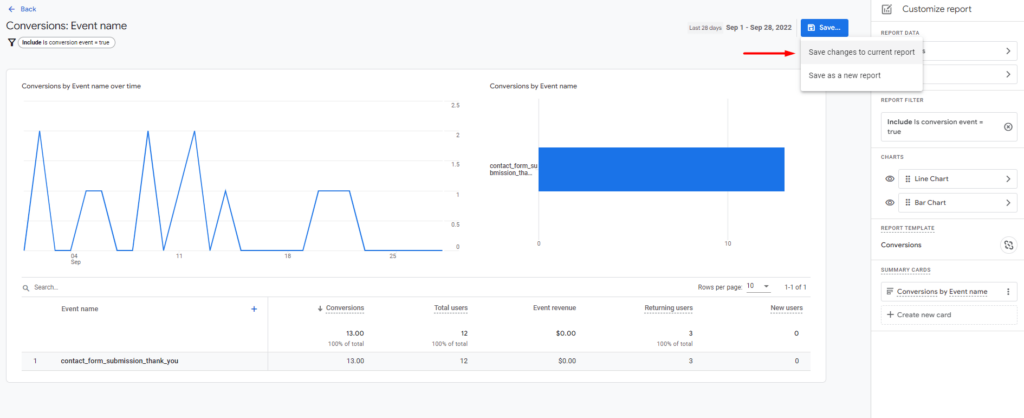
Be sure to save your changes by clicking the blue Save button in the top right corner. You can either save it as a new report or save your changes to the current report. If you save your changes to the current report, this data will be readily available whenever you view the Conversions report.
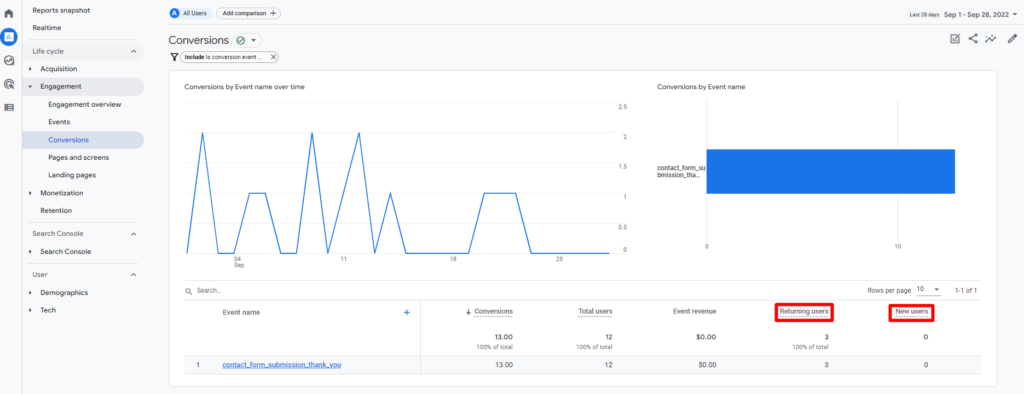
Now you can see how many conversions are from returning users compared to new users, just like you could in Universal Analytics.
GA4 Training and Guides
Want to find data in GA4 that you were used to seeing in Universal Analytics? We have several guides that will walk you through each step in our blog: How to Find Basic Data from UA in GA4.
The team at Evolve Marketing also offers live GA4 training so you can analyze data in GA4 like a pro. Contact us today to get more information or to sign up for a session.